Move and View Selected Charts
You can enlarge, move and choose a specific time frame for monitoring for the selected charts in the home view . Charts can also be viewed in wallboard view.
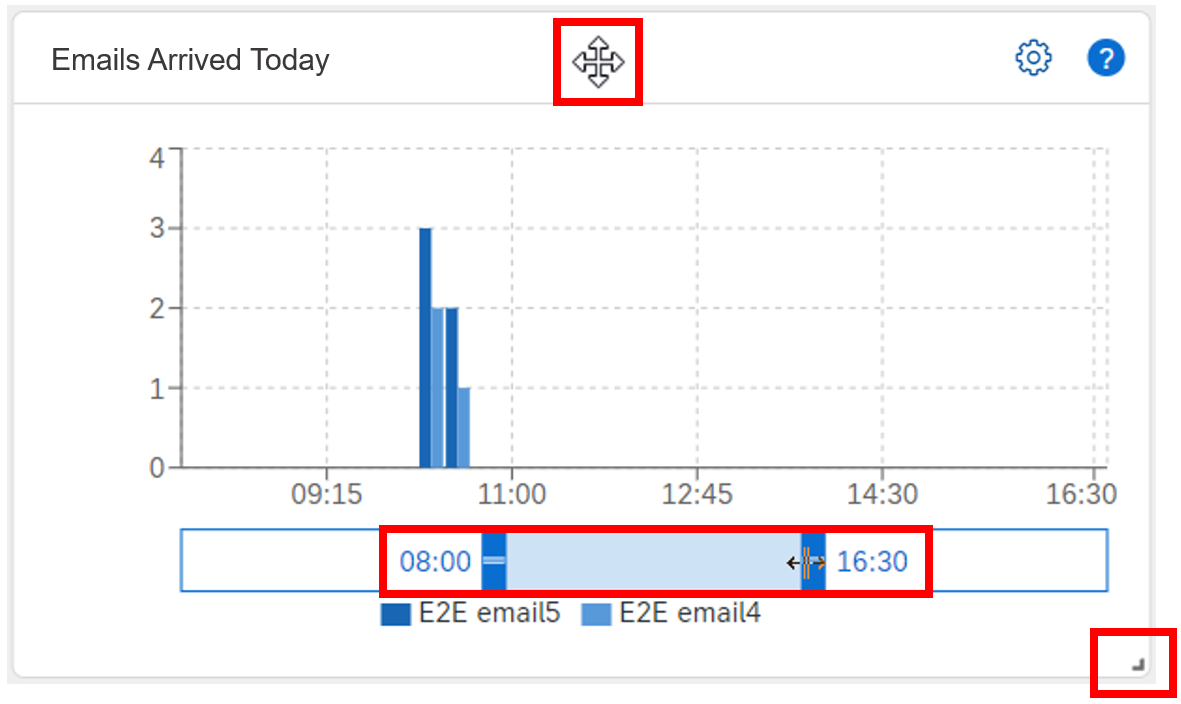
Resizing and Moving Graphs
-
To enlarge or reduce the chart, use the arrow in the bottom right corner.
-
To move the chart, place your mouse pointer over the title bar for the drag icon to appear
-
To view conversations arrived within a particular time period, use the slider.
Wallboard View
-
To display key statistics in full-screen mode, click the arrow icon to activate the Wallboard View.
This way you can drag the view to a different display and show only the selected charts as the browser's address bar and other settings are hidden.
You can also resize and move the graphs in the wallboard view.
-
To leave the view, click the wallboard view icon again or press the Esc key.