UI Settings
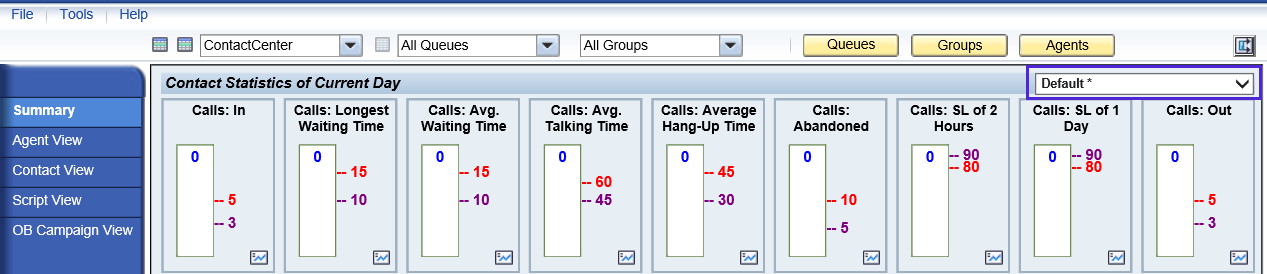
Administrators can create templates that define user interface settings. If you have been given rights to these settings templates, they are available in a drop-down menu on the right side of the Summary view.
You cannot modify the template in the Online Monitoring application, but you can define your own user interface settings in .
You can adjust the following settings:
General Parameters
Time Resolution: Define the time interval that is displayed in the data graphs of the Summary view and used in the monitoring calculations. The choices are 15, 30, and 60 minutes. The default value is 60.
Summary View
Update Interval for Call Statistics: Define how often the statistics view in the Summary view is updated. Choices are from 5 to 60 seconds with 5-second intervals. The default value is 30.
Agent Statistics: Define how often the statistics view at the bottom of the Summary view is updated. Choices are from 10 to 60 seconds with 10-second intervals. The default value is 30.
Agents’ Active Contacts
Max Number of Displayed Agents: Define the number of agents displayed in the Agents Active Contacts view. Administrators define the maximum for this setting in System Configurator ().
Refresh Interval: Define the interval that is used between updating the view when the Auto Refresh option is selected. Administrators define the minimum for this setting in System Configurator ().
Added in SP06.
Agent Statistics
Ask for Confirmation: Define if the supervising tasks, such as changing external agent status, ask for confirmation or not.
Contact View
Max Contact Search Time Range in Hours: Define the maximum time range for contact search. The default value is 24 hours.
Do not set the value greater than 569 hours, Contact View does not work correctly with higher values. Online Monitoring is intended for monitoring the current situation. Use reporting applications, such as SAP BusinessObjects Business Intelligence or Microsoft Reporting Services, to get a view of long-term trends.
Table View
Define critical and warning limits for all calls, abandoned calls, average waiting time, and service level in overall, application and queue data tables.
View Template Settings
Retrieve Current Values: Set the values you have adjusted by dragging the limit lines in the user interface.
Select View Template: Choose the set of settings you want to modify. To add a new set, choose Add New. To delete the chosen set, choose Delete.
Show Element: Select the item if you want to include the variable in the Summary view.
Show Current Value: Select the item to display the current value in the Summary view bar graphs. If it is not selected, the current value is displayed when the cursor is placed on the bar graph.
Ordinal: Define the ordinal number to set the order of the bar graphs in the Summary view.
|
Graph |
Maximum Value |
Critical Limit |
Warning Limit |
|---|---|---|---|
|
Call Settings |
|||
|
Calls: In Queue |
10 |
5 |
3 |
|
Calls: Longest Waiting Time |
20 |
15 |
10 |
|
Calls: Avg. Waiting Time |
20 |
15 |
10 |
|
Calls: Avg. Talking Time |
90 |
60 |
45 |
|
Calls: Avg. Hang-up Time |
60 |
45 |
30 |
|
Calls: Abandoned |
20 |
10 |
5 |
|
Calls: SL of 30 Min |
100 (permanent) |
80 |
90 |
|
Calls: SL of 2 Hours |
100 (permanent) |
80 |
90 |
|
Calls: SL of 1 Day |
100 (permanent) |
80 |
90 |
|
Calls: Out |
10 |
5 |
3 |
|
E-Mail Settings |
|||
|
E-Mails: In Queue |
10 |
8 |
5 |
|
E-Mails: Longest Waiting Time |
600 |
480 |
300 |
|
E-Mails: Avg. Waiting Time |
300 |
240 |
120 |
|
E-Mails: SL of 1 Day |
100 |
90 |
80 |
|
Chat Settings |
|||
|
Chats: In Queue |
10 |
5 |
3 |
|
Chats: Longest Waiting Time |
180 |
90 |
60 |
|
Chats: Avg. Waiting Time |
120 |
60 |
40 |
|
Chats: SL of 2 Hours |
100 |
90 |
80 |
|
Chats: SL of 1 Day |
100 |
90 |
80 |
|
Callback Settings |
|||
|
Callbacks: In Queue |
10 |
5 |
3 |
|
Callbacks: Longest Waiting Time |
180 |
90 |
60 |
|
Callbacks: Avg. Waiting Time |
120 |
60 |
40 |
|
Callbacks: SL of 2 Hours |
100 |
90 |
80 |
|
Callbacks: SL of 1 Day |
100 |
90 |
80 |