Dashboard
The following changes and improvements have been made in Dashboard.
Name Change
Supervisor Dashboard has been renamed to Dashboard. The new name is in use on the UIs but the application URL remains as …/SupervisorDashboard/index.html.
New Queue Serving Status Chart to Home View
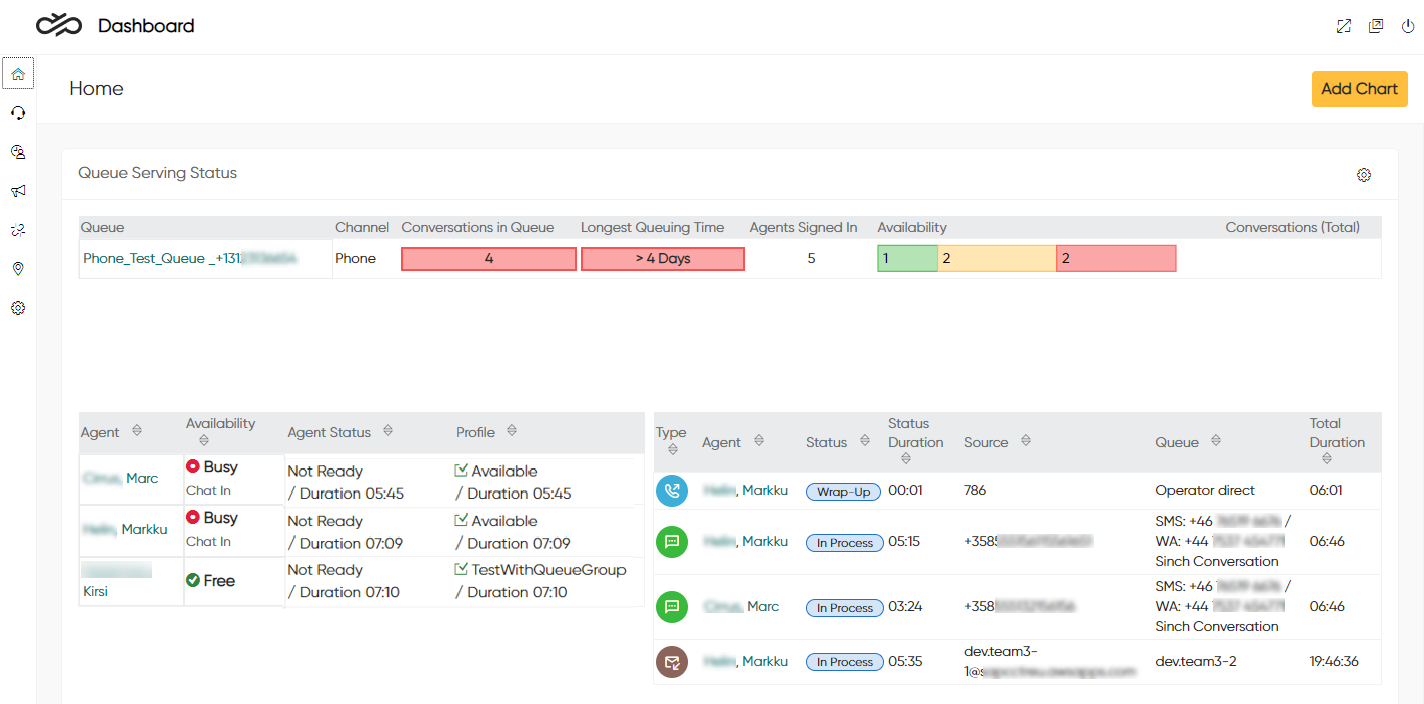
A new Queue Serving Status chart has been added to help team leaders and managers see how a selected queue or queues are being served by the agents who have serving rights for them. The chart includes three tables:
- The top table shows a summary of a queue with the number of queueing conversations and the number of agents signed in.
- The bottom left agent table shows the status of the agents signed in, their availability, and active profile.
- The bottom right conversation table shows all active conversations that are in process, pending, or in wrap-up according to the listed agents.
Abandoned and False Attempt Metrics
Dashboard now provides abandoned and false attempt metrics for phone and chat queues in the Queue Status chart.
Chat Capacity Shown in Agents View and Queue Status Chart
Information of how much capacity has been used or is still available for chat conversations has been added to Dashboard. You can see this info:
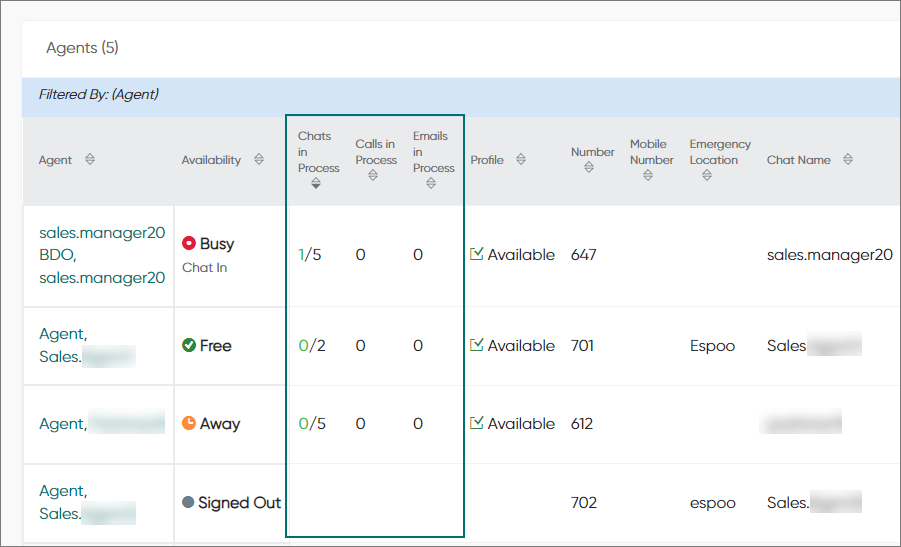
- per agent in the Agents view: The Chats in Process column
shows the number of ongoing chats / the allowed maximum number of chats. In
addition, the Calls in Process and Emails in
Process columns show the numbers of ongoing calls (0 or 1) and
email conversations.
- per queue in the Queue Status chart: The Chat Capacity (Free/Total) column shows
the available chat capacity / the total chat capacity.
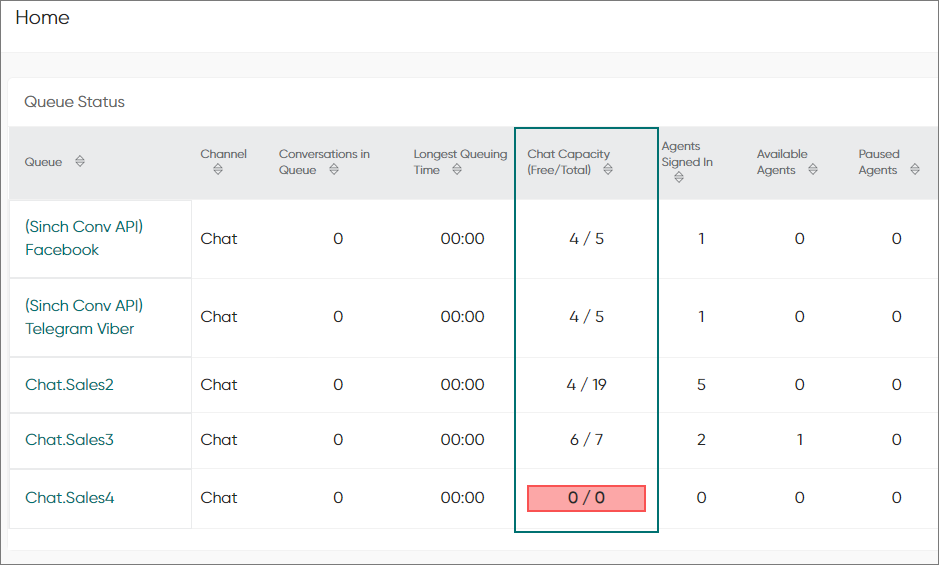
If available capacity is 0, it is shown in red.
Restful Monitoring Interface’s (RMI) queueStatuses and agents requests have also been updated to provide information on chat capacity. For more information, see the API documentation for RMI.
Multiselection to Filters in Conversations View
Possibility to select several values has been added to Conversation Type and Status filters in the Conversations view.
Conversation Details
The Conversations view now provides conversation details. When a user clicks on a conversation row, Conversation Details opens, listing each phase with additional state information. If the conversation is still in process, it's automatically refreshed according to the value in .
The detailed information, events and their states, is available only in English.
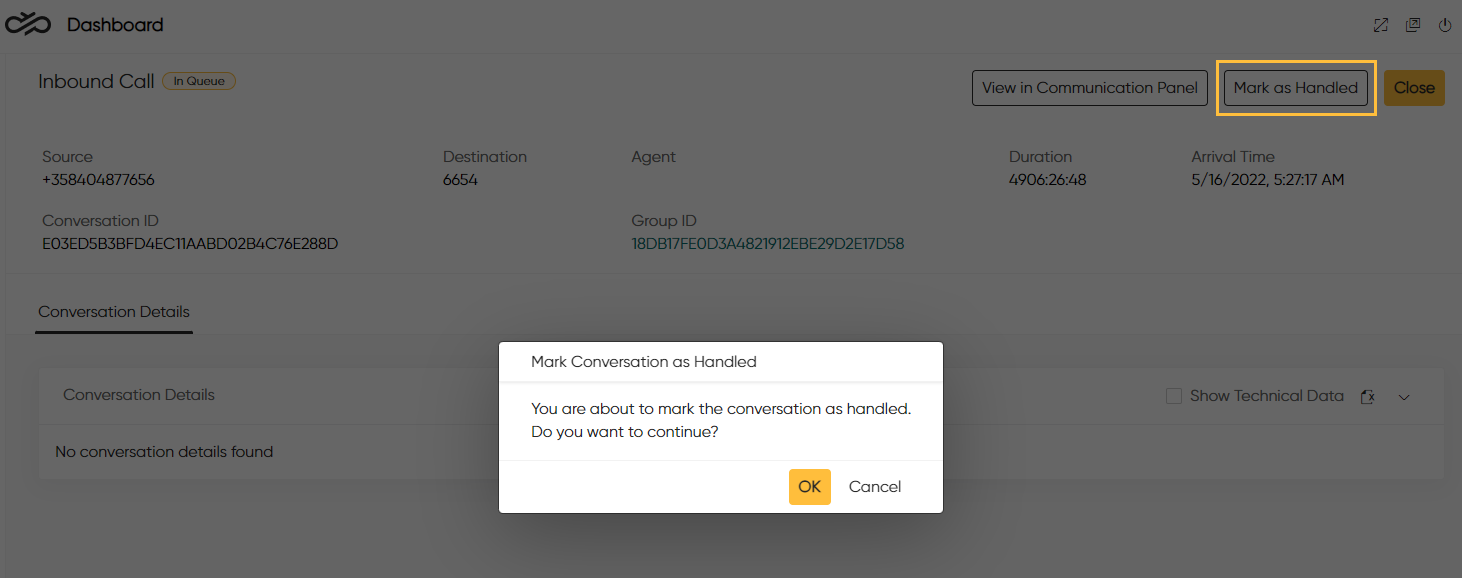
The Conversation Details view includes a Mark as Handled button. The purpose of this button is to add an end event for a conversation. It is intended for managing a situation where a conversation has ended in practice but for some reason the end event is missing. For calls, the button is only available after the call has been running for more than 12 hours. You need user rights to Control Contact to see and use this button.
Restful Monitoring Interface (RMI) can now also add an end event for a conversation.
Selecting the Show Technical Data checkbox converts the event descriptions in State 1 and State 2 columns into their technical form. This technical form is useful when experts are tracing such events in the system logs and alternatively for other developer based actions.
New Campaigns View
A new Campaigns view has been added, allowing users to observe a campaign's status and progress via:
-
Outbound Campaigns: A list of active and passive campaigns, showing statistical information related to the individual campaigns
-
Campaign Details: Detailed information of a selected campaign with a graphical representation of the campaign's status
-
Customers: Detailed call result information at a customer level
A user with rights can also start and stop a campaign by using the Active/Passive toggle. Users need to have rights to the campaigns to be able to view them.
Disruption Management
You can now manage disruption events in the Disruptions view of Supervisor Dashboard. The view is only available when you have rights to disruptions.
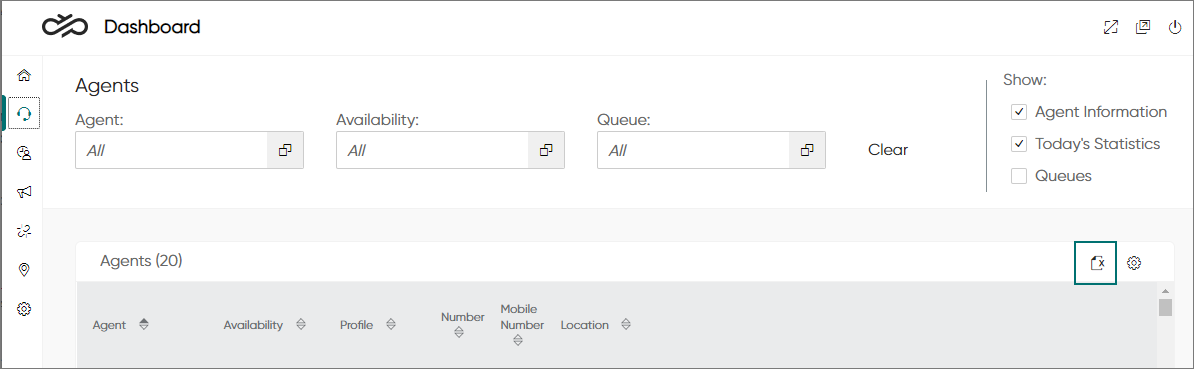
Export to Excel
A button has been added to most tables in Dashboard for exporting data to Excel. In addition to the data from the table, the export includes a timestamp of the export, the user's username, and any filter categories applied. The export only includes data visible in the table, which means that data, for example, from hidden columns or behind the Load More link is not exported. If a recording or script is included in a conversation, the respective column shows text "Recording" or "Script".
Version and Username Shown in Settings
Dashboard settings now show the Contact Pro version and the username of the user.