Statistics Descriptions
Several types of statistics can be displayed for inbound conversations.
| Statistic | Description |
|---|---|
| Calls in Queue | Number of conversations waiting is a queue |
| Chats in Queue | |
| Emails in Queue | |
| Calls: Longest Queueing Time | The longest amount of time that has passed without conversation being
allocated Note that email queuing times don't use schedules. |
| Chats: Longest Queueing Time | |
| Emails: Longest Queueing Time | |
| Inbound Conversations Handled Today | Number of conversations and how they have been handled today |
| Calls Arrived today | Number of conversations arrived today in a queue |
| Chats Arrived today | |
| Emails Arrived today | |
| Calls: Service Level | Service level for conversations arrived today in a queue |
| Chats: Service Level | |
| Emails: Service Level | |
| Queue Status | Combined statistics for queues The queue name works as a link. It opens the Agents table showing the agents that have the selected queue assigned. |
| Disruption Events | Same information as shown in the Disruptions view |
| Campaign Progress | The progress of the campaign The inner layer shows the division of campaign customers into Handled, Max. Calls, Filtered, and Not Handled. The outer layer shows a more detailed breakdown of the campaign customers based on call classifications done by the agents. |
| Queue Serving Status |
How a selected queue or queues are being served by the agents who have serving rights for them. There are three tables:
|
Quick Links
When you click on a queue name in the Queue Status table, it jumps to the related Agent View. For example, if you click on the Sales Queue row in the Queue Status table, it does the following:
-
Moves to Agent view
-
Filtered by Sales Queue
-
Sorted by Presence (descending order of Free, Busy, Away, Signed Out)
-
Queues view selected, so see which agents are signed in
The bars in the charts work as links to the Agents table which shows the agents that have the selected queue assigned.
Combined Statistics
-
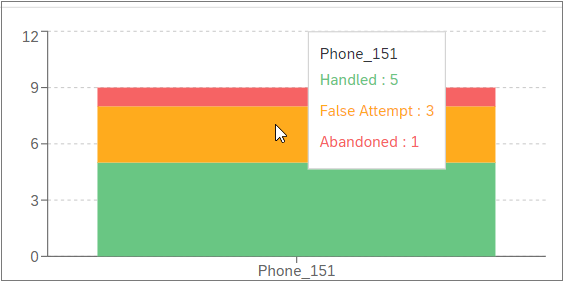
Inbound Conversations Handled Today
This shows all the conversations that have been handled during the past 24 hours for the selected queues:-
Handled: Answered and processed
-
False attempt: Hung up by customers before the false-attempt limit (by default 5 seconds) is reached
-
Abandoned: Hung up by customers before they are answered but after the false-attempt time
-
-
-
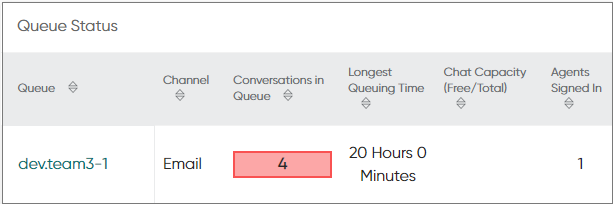
Queue Status
This table shows the following information about all the queues you have selected. By default all the columns are selected. You can deselect columns and change the order of the columns in the card settings by clicking on
 . Your column choices and the order of the columns will be
available when you sign out and sign in again.
. Your column choices and the order of the columns will be
available when you sign out and sign in again.Column Description Queue
Queue name
Channel
Conversation type
Conversations in Queue
Queuing conversations
Longest Queuing Time
The longest time conversations have been waiting in the queue
Agents Signed In
Agents who have signed in to the application
Available Agents
Agents who are ready to receive conversations
Paused Agents
Agents who have activated an absence profile
Handled %
The percentage of conversations that have been answered and processed
Handled
The number of conversations that have been answered and processed
False Attempt % The percentage of conversations that have not been answered, and customer has disconnected before the defined false-attempt limit is reached. False Attempt The number of conversations that have not been answered, and customer has disconnected before the defined false-attempt limit is reached. Abandoned % The percentage of conversations that have not been answered after the defined false-attempt limit is reached. Abandoned The number of conversations that have not been answered after the defined false-attempt limit is reached. SL %
The service level percentage of conversations that have been answered in time during the current day
Average Queueing Time
The average time conversations have been waiting in the queue
Conversations (Total)
The total number of all conversations handled (including false attempts and abandoned conversations)
If threshold levels have been configured in System Configurator, the Queue Status table as well as some of the statistics with the Values per Queue option selected show when the warning (orange color) and critical level (red color) values have been reached. This way you can quickly see which queues require more agents.
You can change the column selection by selecting the Columns tab in the chart settings popup window. To change the column order, select one of the columns and use the arrow icons next to the search field.