Dashboard
The following changes and improvements have been made in the area of Dashboard.
Serving Status
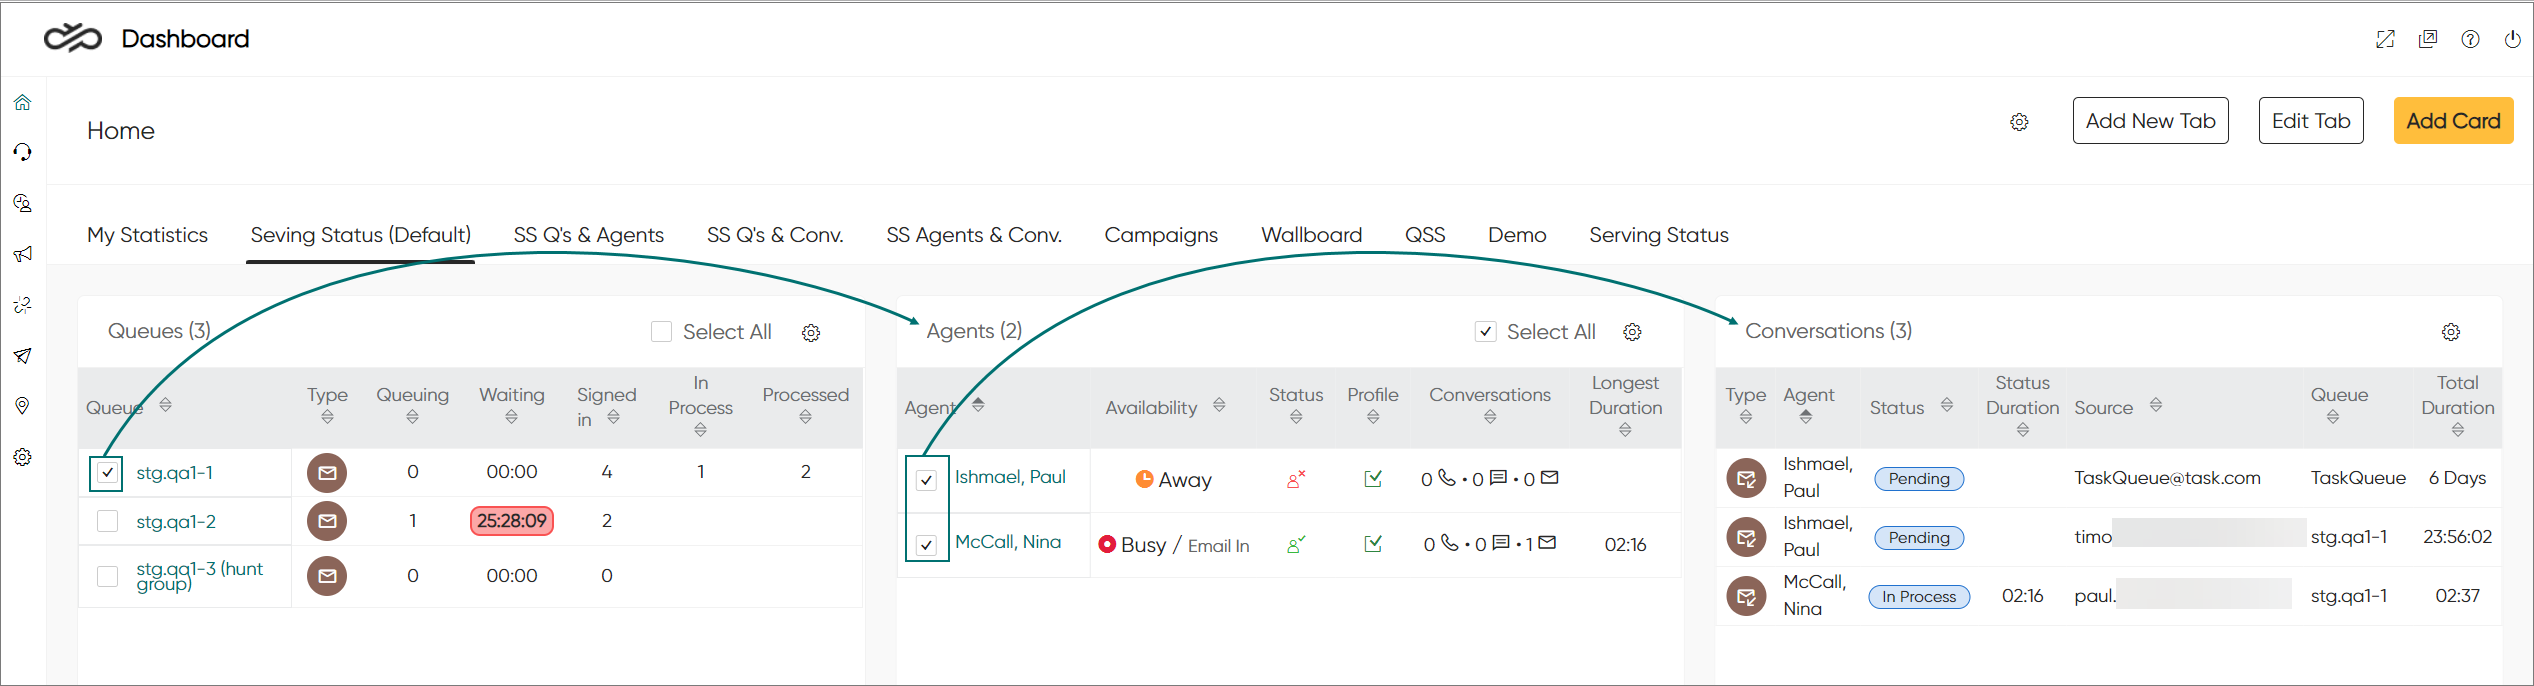
Now you can view queue serving status with the Serving Status, which loads three vertically scaled cards automatically: Queues, Agents, and Conversations. You can resize and move the cards according to your needs. In the Queues card, you can define which queues are displayed by selecting them in the card's settings. Based on your selections in the Queues card, the UI dynamically loads serving agents associated with those queues into the Agents card. Subsequently, the Conversations card populates with conversations involving the selected agents.
Queuing Duration in Conversations view
A new Queuing Duration column has been added to the Conversations view. It shows the actual time a conversation has spent queuing, excluding any automated events such as IVRs or prompts.
New Dashboard
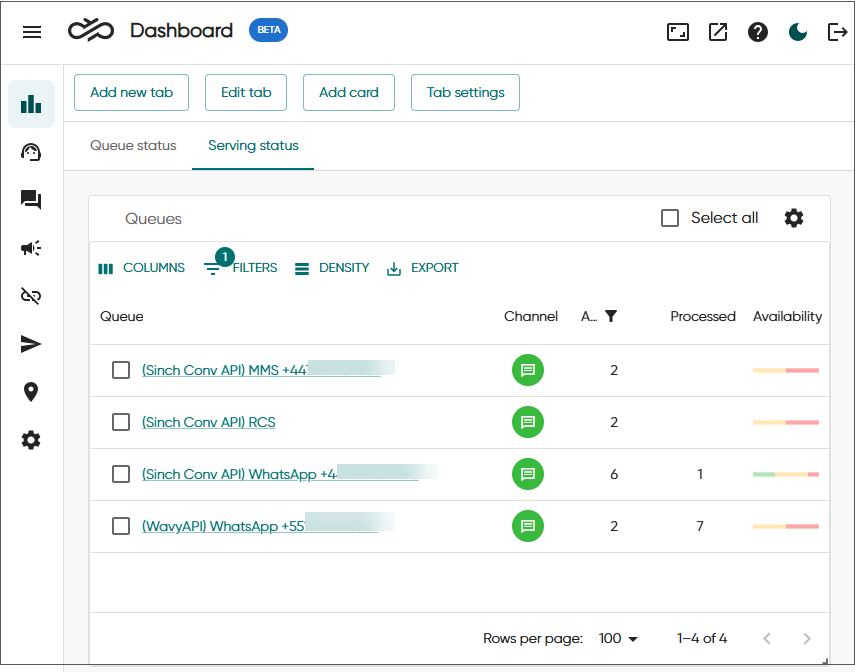
Dashboard is getting a makeover, with a fresh new look and feel from its new React Material UI (MUI) component library. One of the key benefits is the integration of MUI’s Data Grid, which brings improved visualizations and a more structured layout for showing information. It also includes a variety of built-in features such as filtering, column sorting, pagination, data export, and flexible layout options.
The main views have already been updated to reflect the new design. However, the UI remains in beta for FP releases while we continue transitioning all views and incorporating new cards. Currently, the Statistics view (formerly known as the Home view) includes three cards:
- Calls in queue
- Queue status
- Serving status
More updates are on the way as we complete the full rollout.
You can access the new Dashboard via [https://[IP|https://[ip/] address]/dashboard/
Outgoing IVR
Dashboard and reporting now show outgoing calls made by a custom IVR. The number is defined in IVR's callout element.
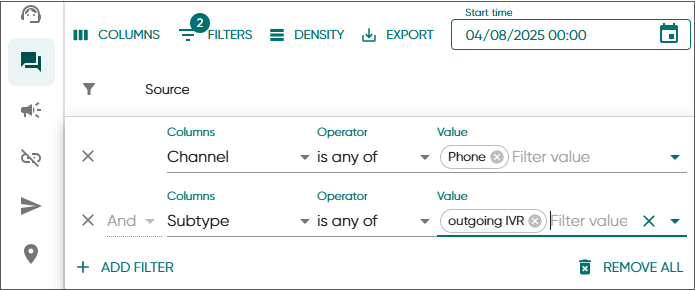
It's possible to filter calls based on a subtype outgoing IVR in the new Dashboard.
Conversation details also show reporting events related to the outgoing IVR.