Summary View
Summary is the default Online Monitoring view, it is displayed when you enter the application. The Summary view consists of three parts: Contact Statistics, Current Day/Reference Day, and Agent Summary. To filter which application, queues and teams are displayed, define statistic level first.
Contacts that arrive when the service is closed are included only in the Service Closed count. To report contacts that have arrived, been handled or abandoned when the service was closed, and to produce other statistics on them, use an IVR application to transfer these contacts to another queue. You can do this in System Configurator by navigating to and choosing Forwarding Number When Service Closed. To report contacts that have arrived, been handled or abandoned regardless of their arrival time, and to produce other statistics on all contacts, do not use service closed schedules for queues whose contacts are handled by overflow to another queue.
Contact Statistics
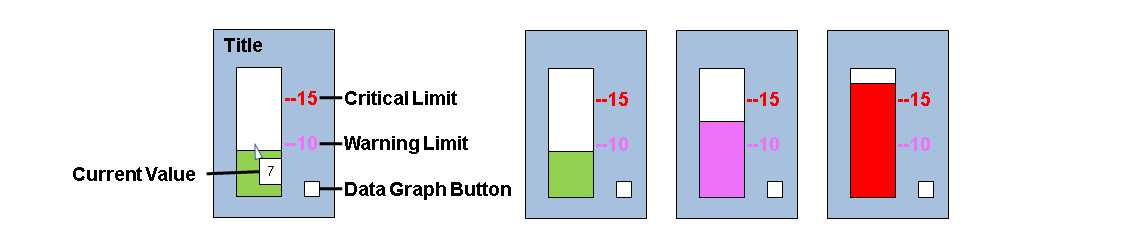
Contact Statistics displays the current contact situation as bar graphs per each contact type:
-
The graph color indicates the performance level. Reference lines with a number are limits of different levels.
-
To adjust a limit for a session, drag the line up or down.
-
To save the changed limits for permanent use, choose anc click Update.
Table 1. Bar Graph Colors Bar Graph Color
Description
Green
Acceptable
Purple
Warning
Red
Critical
-
-
To display the current value on the graph, place the cursor on the graph. To display the value constantly, go to and select the Show Current Value check box for the graph.
-
To open the related data graph, choose the data graph icon beside the bar graph. The cursor on the icon displays the graph title. Displaying the data graph requires that a SVG (Scalable Vector Graphics) viewer software is installed on your computer. The graphs display information per the set time period (15 minutes, 30 minutes, or 1 hour) of the current and reference day. The line graphs indicate the same acceptable, warning and critical performance levels as the summary bar graphs by increasing the brightness of the color.
-
To choose the set of bar graphs and set the performance limits using defined templates, choose the template from the drop-down list on the upper right corner. To define templates, choose . To choose which bar graphs are displayed in the default Summary View, choose the Default template. The available variables are listed below, up to 18 of them can be displayed in the Summary View at a time.
|
Variable |
Description |
|---|---|
|
Calls:In Queue |
The real-time number of inbound calls waiting for service in queues. The data graph displays the arrived and handled calls on the current and reference day. |
|
Calls: Longest Waiting Time |
The longest time calls have been waiting in queues. |
|
Calls: Average Waiting Time |
The average time calls have been waiting in queues. |
|
Calls: Average Talking Time |
The average time between the connection and disconnection points for all answered inbound calls that were not forwarded. For forwarded calls, it is the time between forwarding and disconnection. |
|
Calls: Average Time to Abandon |
The average duration of abandoned calls. Only the ones that have exceeded the False Attempt limit, by default 5 seconds, are included. |
|
Calls: Abandoned |
Calls that have not been answered. Only the ones that have exceeded the False Attempt limit, by default 5 seconds, are included. |
|
Calls: Service Level 2 Hours |
The percentage of calls that have been answered in time out of all arrived calls for the last two hours. Only the ones that have exceeded the False Attempt limit, by default 5 seconds, are included. |
|
Calls: Service Level 1 Day |
The percentage of calls that have been answered in time compared to all arrived calls for the current day. Only the ones that have exceeded the False Attempt limit, by default 5 seconds, are included. |
|
Calls: Out |
The real-time number of outbound internal and external calls. The data graph displays the number of outbound internal and external calls in the current and reference day. |
|
E-Mails: In Queue |
The bar graph displays the real-time number of e-mails waiting for service in queues. The data graph displays the arrived and handled e-mails on the current and reference day. |
|
E-Mails: Longest Waiting Time |
The longest time e-mails have been waiting in queues. |
|
E-Mails: Average Waiting Time |
The average time e-mails have been waiting in queues. |
|
E-Mails: Service Level 1 Day |
The percentage of e-mails that have been answered in time out of all handled e-mails for the current day. |
|
Chats:in Queue |
The bar graph displays the real-time number of chats waiting for service in queues. The data graph displays the arrived and handled chats on the current and reference day. |
|
Chats: Longest Waiting Time |
The longest time chats have been waiting in queues. |
|
Chats: Average Waiting Time |
The average time chats have been waiting in queues. |
|
Chats:Service Level 2 Hours |
The percentage of chats that have been answered in time out of all arrived chats for the current day. Only the ones that have exceeded the False Attempt limit, by default 30 seconds, are included. |
|
Chats: Service Level 1 Day |
The percentage of chats that have been answered in time out of all arrived chats for last two hours. Only the ones that have exceeded the False Attempt limit, by default 30 seconds, are included. |
|
Callbacks: In Queue |
The real-time number of callback requests waiting for service in queues. The data graph displays the arrived and handled callbacks on the current and reference day. |
|
Callbacks: Longest Waiting Time |
The longest time callback requests have been waiting in queues. |
|
Callbacks: Average Waiting Time |
The average time callback requests have been waiting in queues. |
|
Callbacks: Service Level 2 Hours |
The percentage of callback requests that have been answered in time out of all arrived callback requests. |
|
Callbacks: Service Level 1 Day |
The percentage of callback requests that have been answered in time out of all arrived callback requests for last two hours. |
Current Day/Reference Day
Current Day/Reference Day displays the monitored values for the current and previous hour for current and reference day. Choose one of the following refrence day options from the drop-down menu:
|
Display Option |
Description |
|---|---|
|
Today / None |
No reference day, only current values are displayed, also in the line graph Use this option if the number of contacts is very large. |
|
Today / -1Day |
Today / Previous day |
|
Today / -x Days |
Today / The day 2, 3, 4, 5, 6, 7, or 14 days ago, as x indicates |
|
Today / -1 Week (avg) |
Today / Average value of the last 7 days |
|
Today / -1 Month (avg) |
Today / Average value of the last 30 days |
Agent Statistics
The row under the title shows the number of agents that are currently:
-
Logged On: Agent logged into the system (Ready + Not Ready + Paused)
-
Ready: Agents with Ready status
-
Free: Agents free to take calls from the queues and able to receive direct calls (Agents with Ready login status and Free phone status).
-
Wrap-Up: Agents with Wrap-up + OB (wrap-up) phone status (former Afterwork status).
-
Not Ready: Agents with Not ready status (An agent is temporarily unable to take calls from queues, but is able to receive direct calls).
-
Paused: Agents who have activated an absence- or away-type profile.
-
Call: Agents with Ready login status and Busy (call in) or Busy (call out) or OB (call out) phone status.
-
E-Mail: Agents with Busy (e-mail) phone status.
-
Chat: Agents with Busy (chat) phone status.
-
OB Campaign: Agents who have logged in an outbound campaign.
Under the Agent Statistics row, a table shows up to 50 agents that are currently active, or have been logged on the current day.