Agent statistics
This tab is for supervisors to view their agents' performance for a specific campaign.
- have the setting Enable Supervisor Elements and Actions selected in SC user settings template
- have rights for the user(s)
To narrow down the statistics shown, select the agent(s), campaign, and date range and click Search.
To sort the information and change the columns shown in the table, see Sort, edit, and export tables.
| Column | Description |
|---|---|
| Agent | The name of the agent |
| Calls Made |
Number of calls made in the campaign during the current day / overall campaign total |
| Handled |
The number of customers that have a campaign outcome and do not require more call attempts |
| Success |
Number of calls where the agent has classified the call as Success |
| Refusal | Number of calls where the agent has classified the call as Refusal |
| Called Success Rate |
Percentage of handled calls where the agent has classified the call as Success |
| Talking Time Avg. |
Average talking time for a campaign call, per campaign. Displayed as average talking time for the current day / average talking time overall for the campaign |
| Total Talking Time |
Cumulative talking time for connected campaign calls. For Predictive campaigns, this includes any time where prompts messages were played for a queuing customer. On the Agent Statistics tab, this includes the talking time of the selected agents who participated in the selected campaign. |
| Campaign Progress |
Progress of the campaign shown as a
stacked bar chart:
Hover your cursor over the chart to see the detailed total numbers for each result. 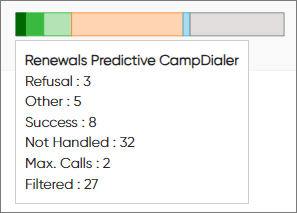
|