Statistics
Add and view statistics in the Home view.
- Queuing and handled conversations
- The service level for the selected queues
- The progress of selected outbound campaigns
You can also create a wallboard experience.
The Home view offers a tabbed approach so to increase yet simplify the layout of your statistics. For each tab you create cards which contain your statistic and allows you to scale and position it per your taste. You can add cards per dedicated subject tabs or repeat cards in more tabs to extend and simplify your statistics layout.
- Rights to either view or serve in queues/queue groups or statistics summary or statistics details for queues/queue groups
- Statistics summary for users
Getting started with statistics
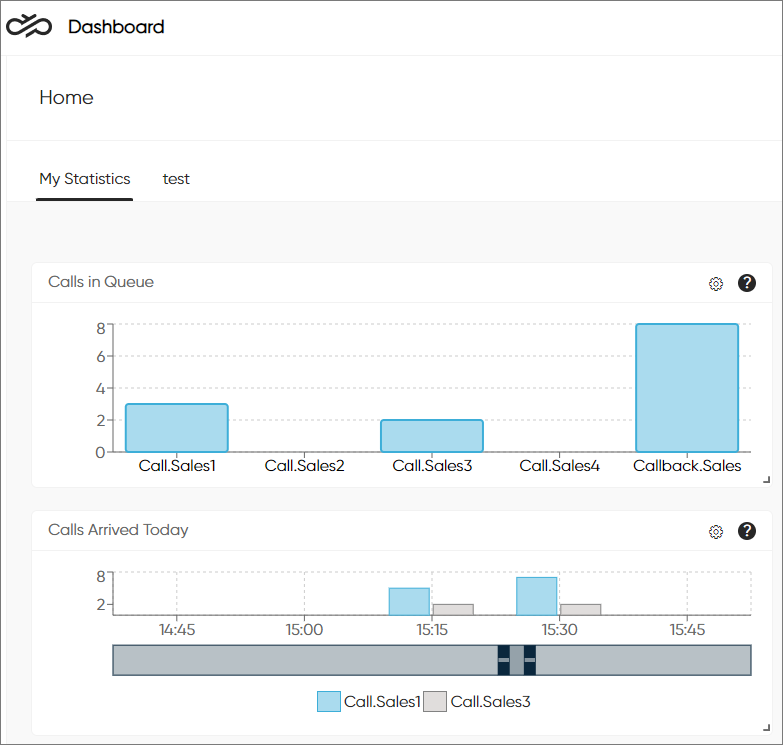
When you open the application for the very first time, the Home view has an initial tab called My Statistics but no data.
Chart and numerical statistics
You can view most statistics as two different types:
-
Chart shows statistics drawn as a graph or a pie chart
-
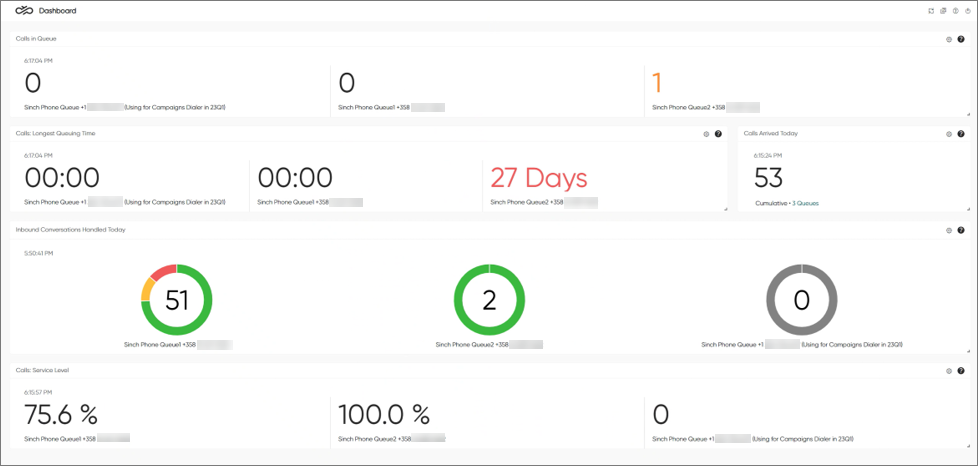
Numerical shows statistics as key figures in a large font
Numericals can be shown as values per queue or as cumulative.
Since you can select for each statistic if it should be shown as a chart or numerical, a tab can include statistics of both types at the same time. To switch between the two types, use the button:
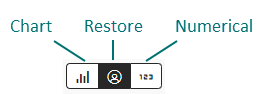
When you switch the type, all statistics on the tab will be shown as either charts or numericals. To return a tab with a mix of charts and numericals to its original state, click the middle button.