Statistics examples
Here are two examples of how to add statistics into the Home view. The first example shows the number of calls in the selected queues, while the focus of the second example is the number of serving agents in these queues.
Are there calls in the queue?
- In the Home view, add a new tab or use the initial tab
My Statistics.
If you feel that the tab name is not descriptive enough for your purpose, rename it by clicking Edit Tab, change the name and click OK.
To create a new tab, click Add New Tab, enter a name for it, and click OK.
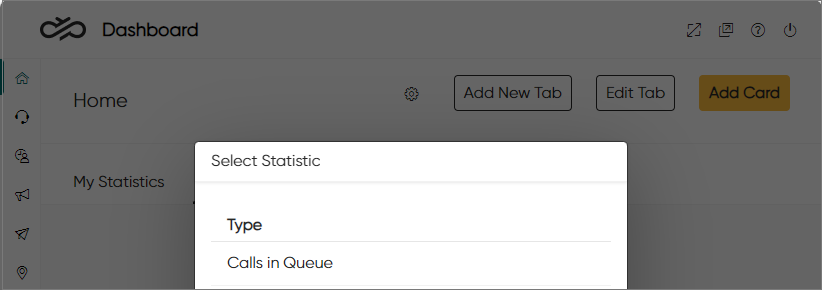
- Click Add Card and select Calls in Queue.
- Define the card content and its format:
Name the card.
Select one of the following:
Values per Queue: The card shows a value for each queue that has been selected.
Cumulative: The card shows one cumulative value for the selected queues.
Select the type:
Chart: The card shows statistics drawn as a graph or a pie chart.
Numerical: The card shows statistics as key figures in a large font.
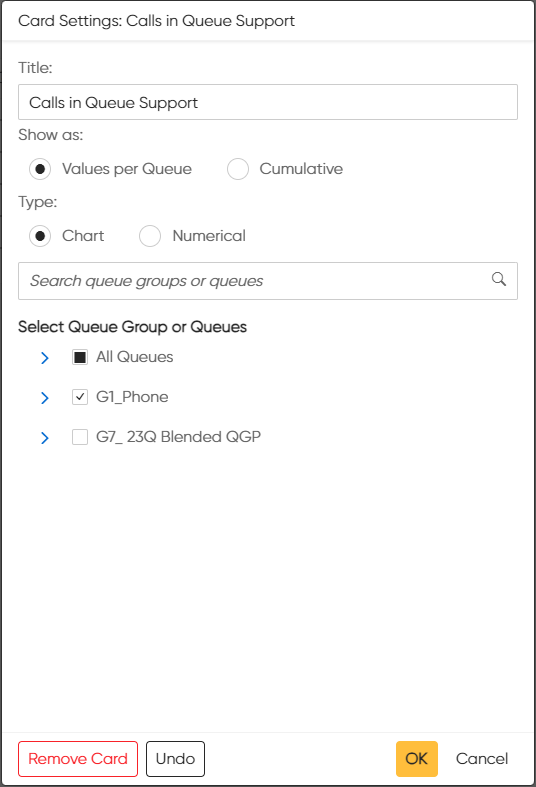
Select the queues and click OK.
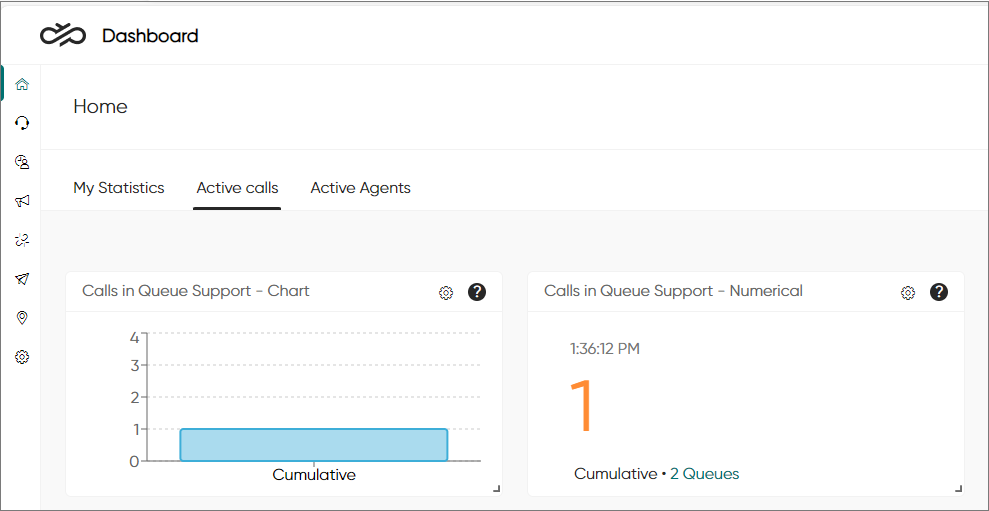
Below is the calls in queue presented as a chart and in numerical format:
If later needed, you can go back and change your selections
by clicking the settings icon ![]() .
.
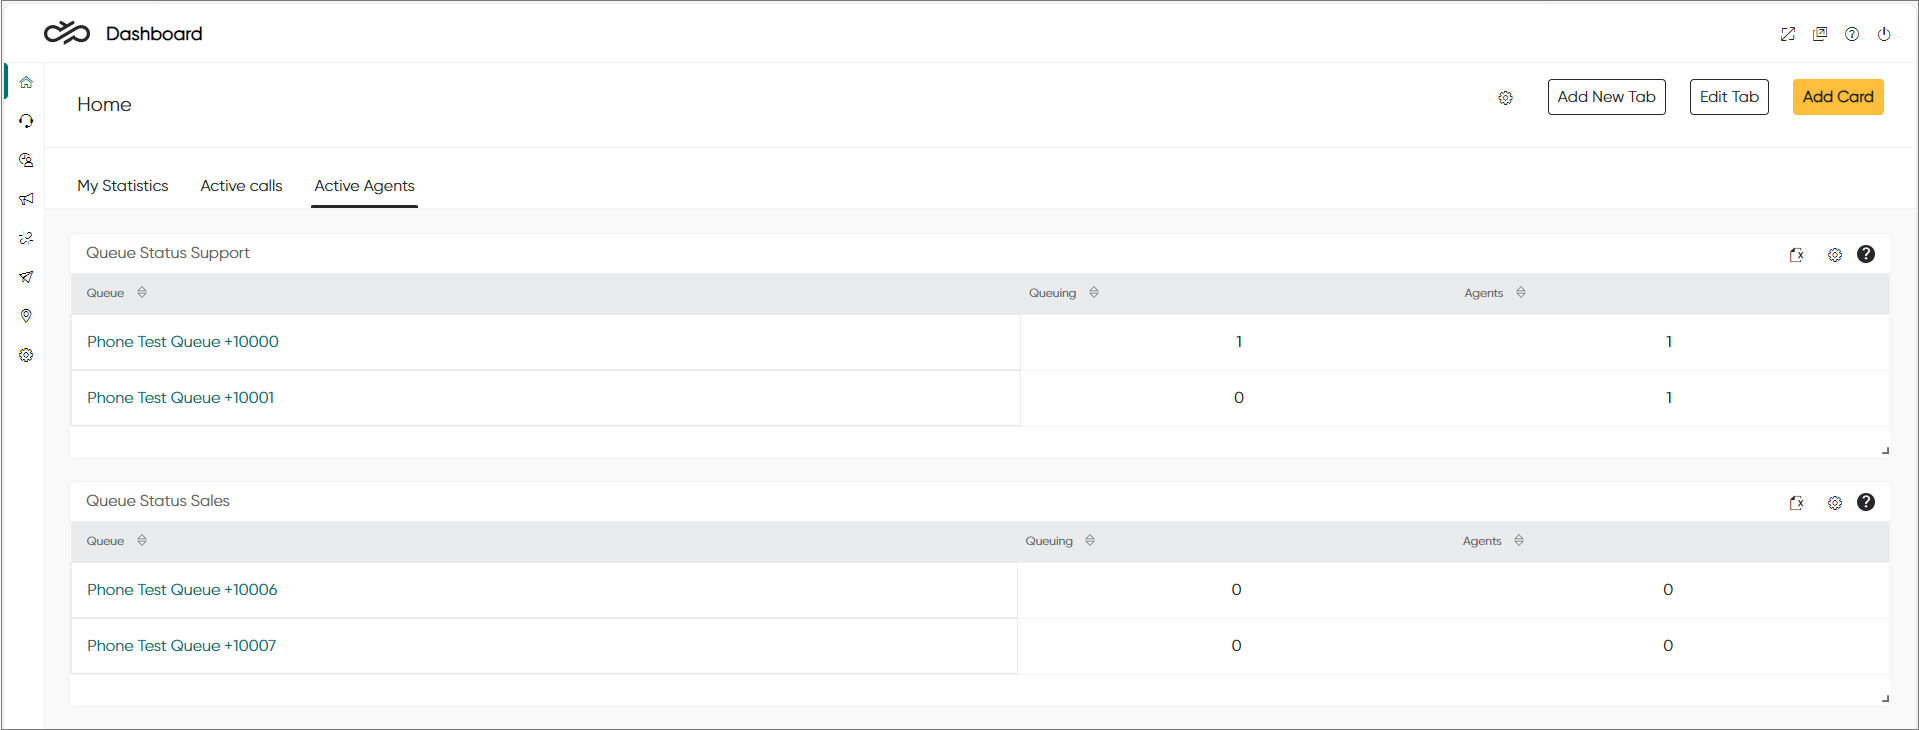
Are there agents serving in the queue?
- In the Home view, click Add Card and select Queue Status.
- Name the card and select the queues.
- In the Columns tab, select the columns to be shown in the
card. For this example, we select only Queuing and
Agents.
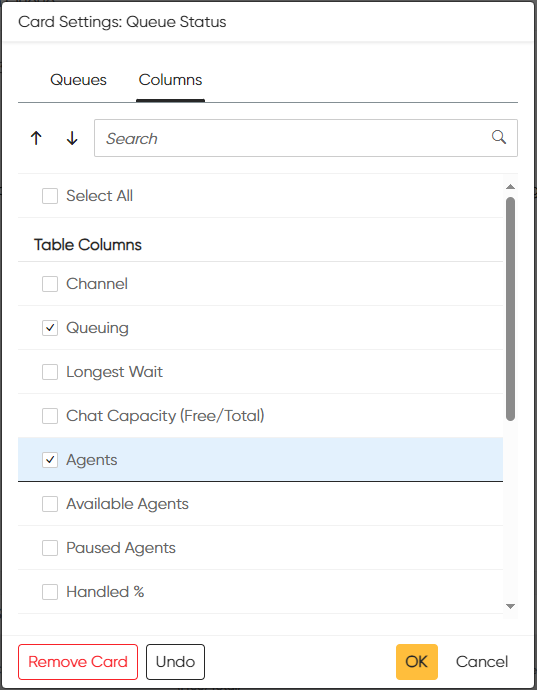
Click OK.
The Home view now shows queuing calls and serving agents in the selected queues.
If you want to see details of the agents' availability (for example how long they've been free/busy/away) use the card Serving Status.
To see when warning and critical levels for queues have been reached, define them in .