Add cards
Add and configure one card at a time using the following instructions.
- Longest queuing time
- In queue
- Handled today
- Arrived today
- Service level
- Queue status
- Serving status
- Campaign progress
- Disruption events
Queuing time visualization and threshold settings
The colors and scale of the gauge or bar in the cards Longest queuing time, In queue, and Service level are based on the settings configured in System Configurator (SC). Check with your administrator to ensure the following values have been set for the queues you selected.
Queue or channel setting Answered-on-time limit: The gauge and bar overall scaling are based on the values defined for this setting.
Queue level setting Warning level of queuing time: When the queuing time exceeds the defined value, the gauge, bar, and numeric will turn yellow.
Queue level setting Critical level of queuing time: When the queuing time exceeds the defined value, the gauge, bar, and numeric will turn red.
After changing the SC settings, Dashboard must be reloaded for the changes to take effect.
You can choose one or more queues. A single card can contain a mix of channel types, such as calls, emails, and chats.
-
Card with a single queue: The gauge, bar, or numeric increases based on the conversation with the longest queuing time in the queue, progressing through the green stage (acceptable queuing time) yellow stage (warning level queuing time) then red (critical level queuing) until the answered-on-time limit is met or exceeded.
-
Card with multiple queues: The card focuses on queues with the longest-waiting conversation or the largest number of conversations. Using the link to the dropdown gives a further breakdown of the listed queue situations.

Card scaling
When cards are reduced to their minimum scale, specific elements adjust automatically to maintain optimal clarity and usability. For example, bar and gauge cards transition to a numerical presentation, which is more appropriate for smaller display formats. Additionally, the refresh time is removed for minimum proportioned cards.
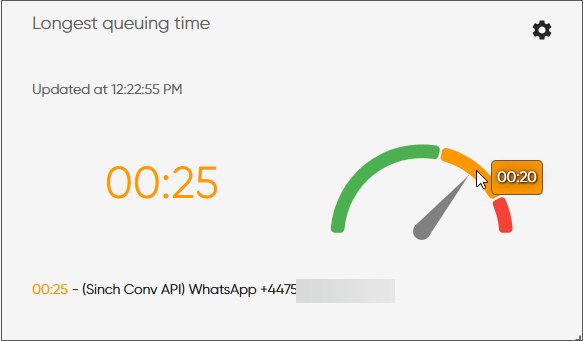
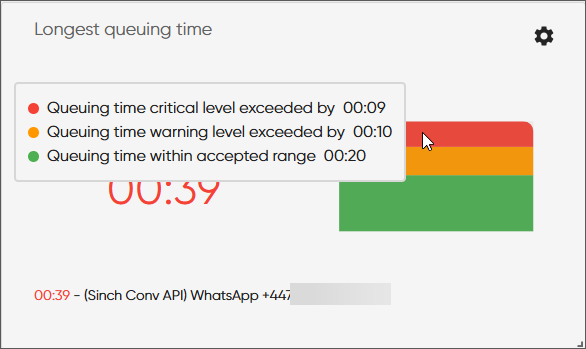
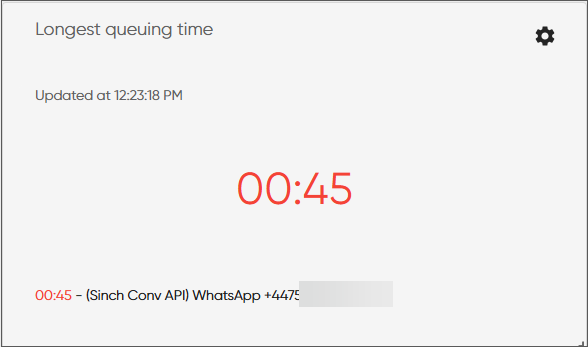
Longest queuing time
This card shows the progress of a conversation that has the longest queuing time. (Visual alerts require the queuing time threshold values and answered-on-time limit to be set in SC.)
Choose the tab where you want to add the card and click Add card.
The Select statistic popup window opens.
-
Click Longest queuing time and then OK.
The Card settings popup window opens.
Keep the name or enter a new one. You can also adjust the font size.
The changed font size will be shown when the card is added to the Statistics view.
-
-
Choose how to visualize the information:
-
Gauge
Hover over the gauge and you'll see the defined warning and critical times.
-
Bar
Hover your cursor over the bar and you'll see the defined answered-on-time-limit and warning and critical times.
-
Numeric
-
-
Select one or more queues that you want to monitor with this card.
When you're done with card settings, click OK.
The card shows up on the tab.
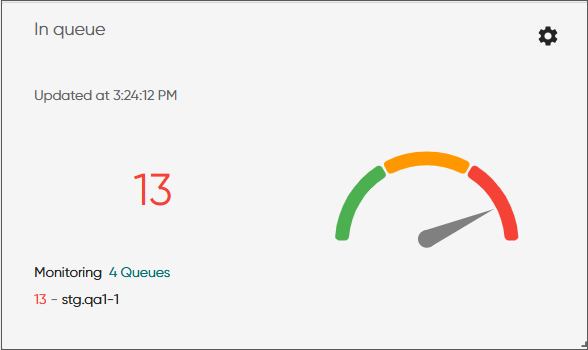
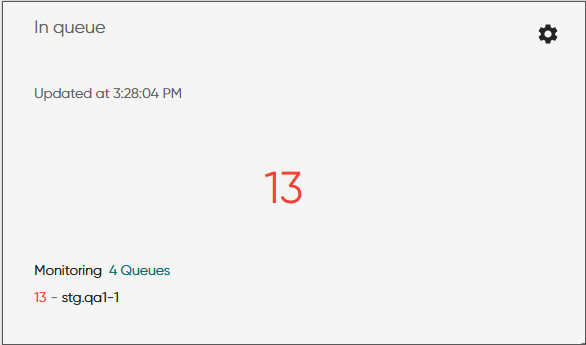
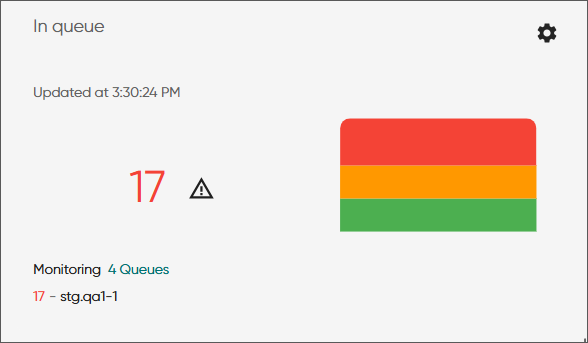
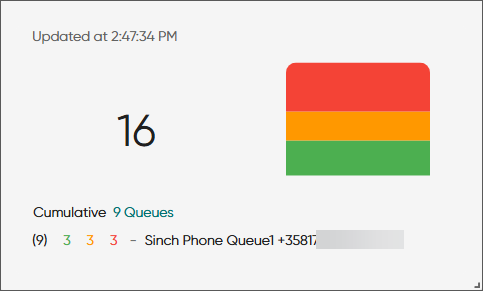
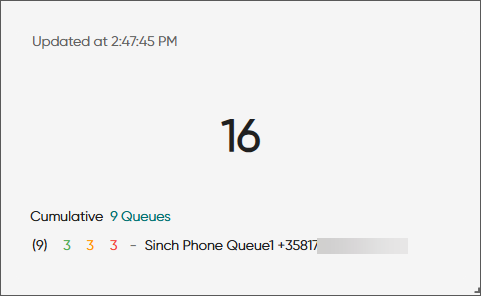
In queue
This card shows the conversations that are queuing. (Visual alerts require the queuing conversations threshold values and queue size to be set in SC.)
Choose the tab where you want to add the card and click Add card.
The Select statistic popup window opens.
-
Click In queue and then OK.
The Card settings popup window opens.
Keep the name or enter a new one. You can also adjust the font size.
The changed font size will be shown when the card is added to the Statistics view.
-
Choose how to visualize the information:
-
Gauge
-
Bar
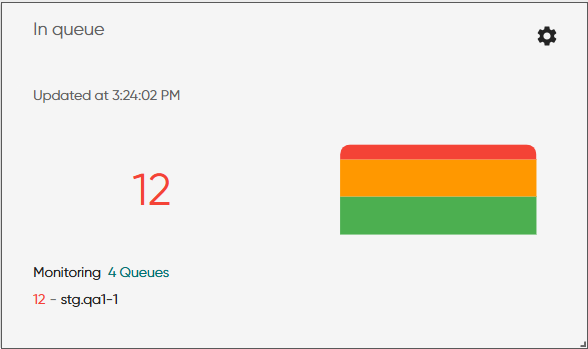
-
Numeric
When the queue size is exceeded, the card indicated this.
-
Select one or more queues that you want to monitor with this card.
When you're done with card settings, click OK.
The card shows up on the tab.
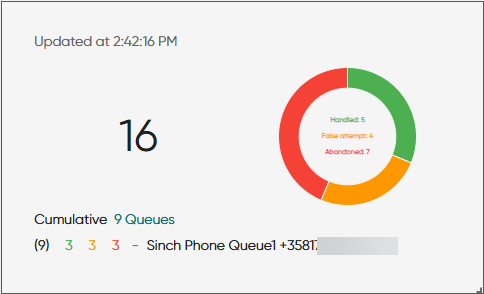
Handled today
This card shows incoming conversations that have been handled during the current day and are considered as:
-
handled
Conversations that have been answered and processed
-
false attempts
Conversations that haven't been answered, and customer has disconnected before the defined false-attempt limit is reached
-
abandoned
Conversations that haven't been answered after the defined false-attempt limit is reached
Choose the tab where you want to add the card and click Add card.
The Select statistic popup window opens.
-
Click Handled today and then OK.
The Card settings popup window opens.
Keep the name or enter a new one. You can also adjust the font size.
The changed font size will be shown when the card is added to the Statistics view.
-
Choose how to visualize the information:
-
Donut chart
Clicking inside the chart toggles the visibility of the statistics.
-
Bar
-
Numeric
-
Select one or more queues that you want to monitor with this card.
When you're done with card settings, click OK.
The card shows up on the tab.
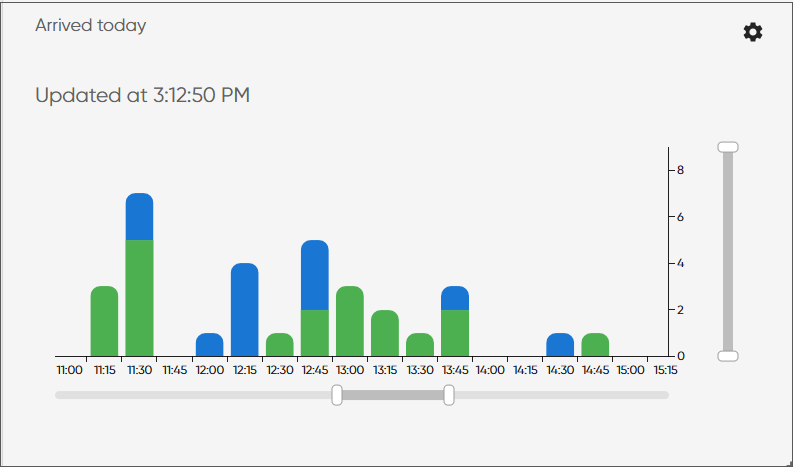
Arrived today
This card shows incoming conversations that have arrived during the current day including false attempts and abandoned conversations.
Choose the tab where you want to add the card and click Add card.
The Select statistic popup window opens.
-
Click Arrived today and then OK.
The Card settings popup window opens.
Keep the name or enter a new one. You can also adjust the font size.
The changed font size will be shown when the card is added to the Statistics view.
-
Choose how to visualize the information:
-
As cumulative shows one bar with all selected queues.
-
Per queue shows a bar for each selected queue.
-
Numeric shows the time as a simple number.
The bar chart shows conversation count for each 15-minute interval, while the numeric card represents the total conversation count for the day so far.
-
Select one or more queues that you want to monitor with this card.
When you're done with card settings, click OK.
The card shows up on the tab.
-
Scale the chart with the horizontal and vertical sliders.
-
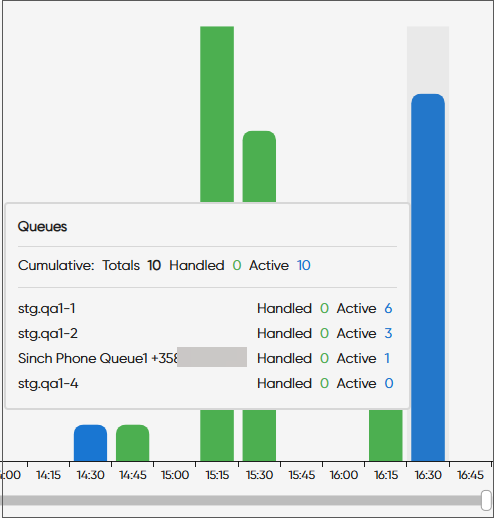
In a cumulative card, hover your cursor over the bar to see the number of handled conversations and the number of conversations that are queuing or with an agent.
Service level
This card shows the service level of selected queues. The service level percentage is calculates as follows:
100 x answered on time / (handled + abandoned)
The gauge and bar scaling as well as the threshold colors used are derived from the queue-level threshold settings for the service level.
Choose the tab where you want to add the card and click Add card.
The Select statistic popup window opens.
-
Click Service level and then OK.
The Card settings popup window opens.
Keep the name or enter a new one. You can also adjust the font size.
The changed font size will be shown when the card is added to the Statistics view.
-
Choose how to visualize the information:
-
Service level percentage of the selected queues as Gauge.
-
Service level percentage of the selected queues as Bar.
-
Service level only as percentage
-
Bar chart per queue shows a bar for each selected queue
-
Bar chart as cumulative shows one bar with all selected queues
The As cumulative and Per queue options present the service level in 15‑minute intervals and allow you to scale the chart with the horizontal and vertical sliders. Hover your cursor over the bar to see the service level percentage.
Figure 1. Per queue 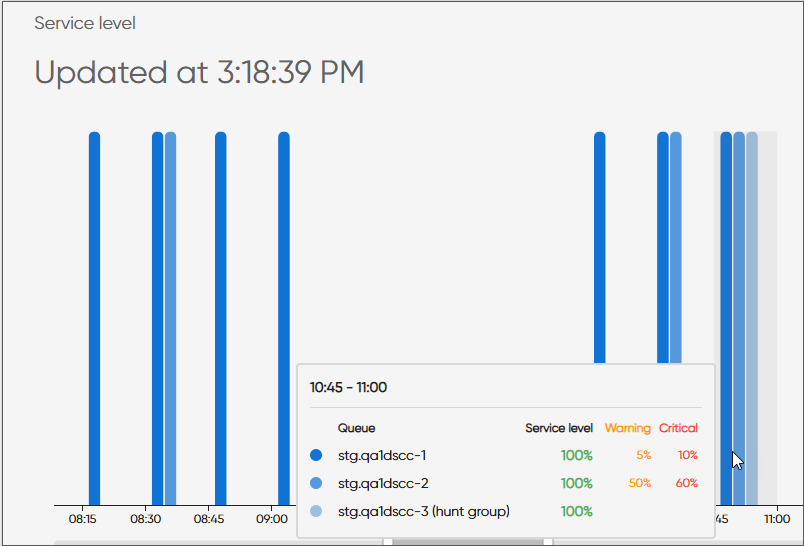
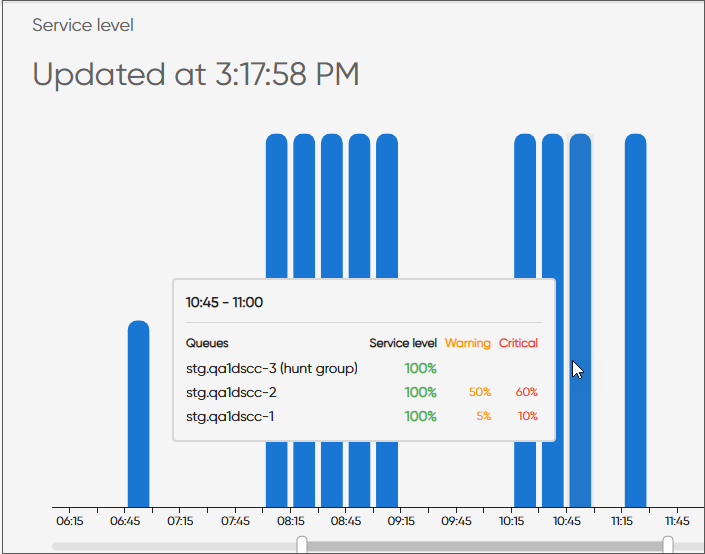
Figure 2. Cumulative -
Select one or more queues that you want to monitor with this card.
When you're done with card settings, click OK.
The card shows up on the tab.
Queue status
This card shows combined statistics for queues. The queue name works as a link. It goes to the Queues tab in the Agents view showing the agents that have the selected queue assigned.
Choose the tab where you want to add the card and click Add card.
The Select statistic popup window opens.
-
Click Queue status and then OK.
The Card settings popup window opens.
-
Keep the name or enter a new one.
Select one or more queues that you want to monitor with this card.
-
When you're done with card settings, click OK.
The card shows up on the tab. By default the card shows all the columns.
| Column | Description |
|---|---|
|
Queue |
Queue name |
|
Channel |
Conversation type |
|
Queuing |
Number of conversations in queue |
|
Longest wait |
Longest queuing time |
|
Chat capacity (free/total) |
Shows the available chat capacity / the total chat capacity |
|
Agents |
How many agents are signed in to that queue |
|
Available agents |
Agents who are ready to receive conversations |
|
Paused agents |
Agents who have activated an absence profile |
|
Handled % |
The percentage of conversations that have been answered and processed |
|
Handled |
The number of conversations that have been answered and processed |
| False attempt % | The percentage of conversations that have not been answered, and
customer has disconnected before the defined false-attempt limit is
reached. This is calculated as follows: 100 x false-attempts / (handled + abandoned + false attempts) |
| False attempt | The number of conversations that have not been answered, and customer has disconnected before the defined false-attempt limit is reached. |
| Abandoned % | The percentage of conversations that have not been answered after
the defined false-attempt limit is reached. This is calculated as follows: 100 x abandoned/ ( handled + abandoned + false attempts ) |
| Abandoned | The number of conversations that have not been answered after the defined false-attempt limit is reached. |
|
Service level % |
The service level percentage of conversations that have been answered in time during the current day This is calculated as follows: 100 x answered on time / (handled + abandoned) |
|
Average queuing time |
The average time conversations have been waiting in the queue This is calculated as follows: (Total queuing time of answered + total queuing time of abandoned) / (handled + abandoned ) |
|
Processed |
The total number of all conversations handled (including false attempts and abandoned conversations) |
Serving status
This card shows how a selected queue or queues are being served by the agents who have serving rights for them. The information is shown in separate tables you can resize and move.
Choose the tab where you want to add the card and click Add card.
The Select statistic popup window opens.
-
Click Serving status and then OK.
The Card settings popup window opens.
-
Rename Queues if needed.
The names Agents and Conversations are fixed.
Select one or more queues that you want to monitor with this card.
-
When you're done with card settings, click OK.
The card shows up on the tab. Not all columns are shown by default.
| Column | Description |
|---|---|
| Queue | Queue name |
| Channel | Conversation type |
| Queuing | Number of conversations in queue |
| Longest wait | Longest queuing time |
| Agents | Number of agents serving in queue |
| In process | How many conversations are actively being handled from that queue |
| Processed | The total number of conversations handled so far for the current day |
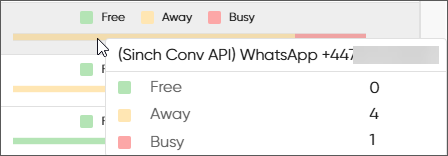
| Availability | The grapic shows the following:
|
| Column | Description |
|---|---|
| Agent | Agent name |
| User group | The user group the agent belongs to |
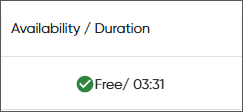
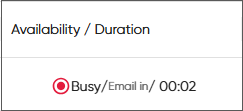
| Availability / Duration | Agent's readiness to accept conversations. If the agent's
availability is free, the duration implies this is the time the
agent has been without any conversations. When an agent is seen as
busy, a conversation type is stated along with its
duration.
For example, if an agent has a call and a chat, the column shows the call as the conversation the agent is busy with and its duration. |
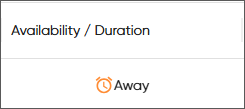
| Availability | Agent's readiness to accept conversations: free, busy, or away |
| Agent status / Duration | Icon shows ready or not ready status. Time indicates the duration of this status. |
| Status | Icon shows ready or not ready status. |
| Profile / Duration | The current profile held. Time indicates the duration of this profile. |
| Profile | The current profile icon type which can be presence, absence, or tentative. |
| Conversations | Number of conversations in process with the agent per conversation type. Pending conversations and wrap-up conversations are excluded in the Agents card count. |
| In process | Total number of conversations the agent has in process |
| Longest duration | Based on the conversation which has been in process with the agent the longest |
| Column | Description |
|---|---|
| Channel | Conversation type: call, chat, email, or task |
| Agent | Agent name |
| Status | Status of the conversation: in process, pending, or wrap-up |
| Status duration | How long this conversation status has lasted |
| Source | The queue from which the conversation has arrived |
| Queue | The queue name |
| Subject | For conversations from the email channel it's the subject of an email. For conversations from the chat channel it's customer messages. |
| Arrival time | The time the conversation has arrived to the contact center |
| Disconnection time | The time the agent or customer hangs up the call or ends a chat. Wrap-up time is excluded. |
| Total duration | The overall time the agent has taken with the conversation (until wrap-up ends) |
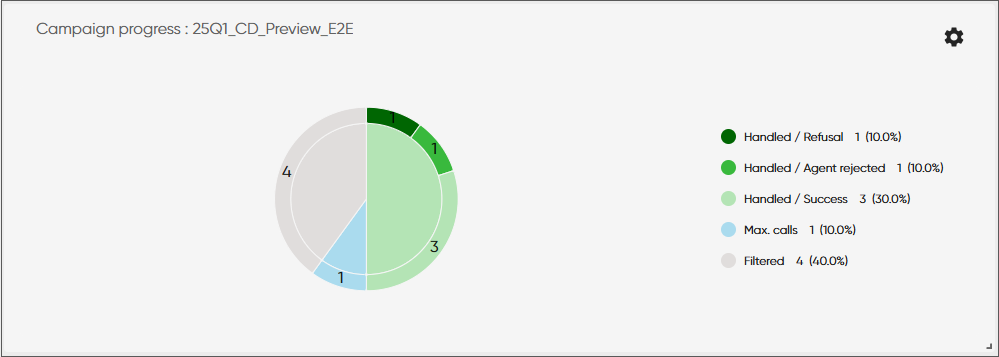
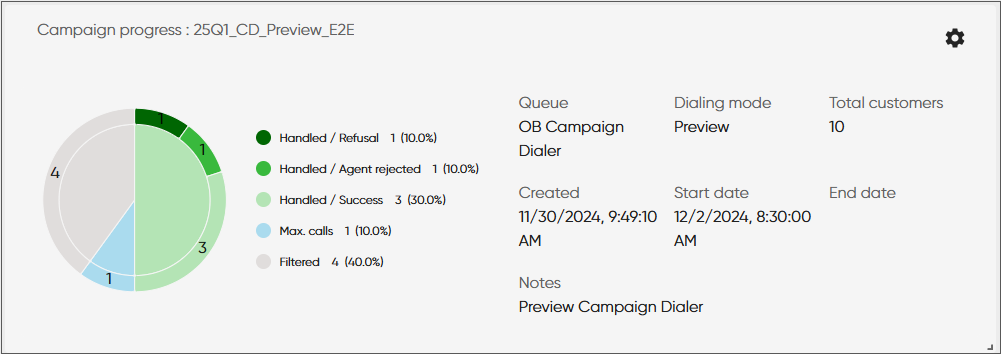
Campaign progress
This card shows information on the progress of selected campaigns.
Choose the tab where you want to add the card and click Add card.
The Select statistic popup window opens.
-
Click Campaign progress and then OK.
-
Choose how to visualize the information:
-
Pie chart
-
Pie chart with details
-
-
Choose one campaign.
-
Show only active lists the active campaigns.
-
Show all lists all campaigns you have rights to see.
-
-
When you're done with card settings, click OK.
The card shows up on the tab.
In the nested pie chart, you can see the progress of the campaign. The inner layer of the chart shows the division of campaign customers into:- Handled:
The number of customers that have a campaign outcome and do not require more call attempts
- Max. calls
The number of customers that have been called as many times as defined in any of the Number of redials fields in the campaign's settings in System Configurator.
- Filtered
Number of customers that have been filtered out from the campaign so will not be called
- Not handled
Number of customers that have not been called yet (who are not Handled, Max. calls, or Filtered)
This number tells you how much of the campaign remains to be completed.
The outer layer of the chart shows a more detailed breakdown of the campaign customers based on:- call classifications done by the agents when the customer has been reached
- current customer results assigned by the system when the customer has not been reached
If the campaign's dialing mode is Predictive, you'll also see the following fields:
- Increase ratio: Calls made in the campaign = Free agents + (Ratio % * Busy agents)
- Abandoned ratio: The maximum percentage of calls dropped due to no free agent being available.
- Handled:
Disruption events
This card shows events of a selected disruption item.
Choose the tab where you want to add the card and click Add card.
The Select statistic popup window opens.
-
Click Disruption events and then OK.
The Card settings popup window opens.
-
Select the disruption item you want to monitor.
When you're done with card settings, click OK.
The card shows up on the tab.