My statistics
This tab is for the agent using Dashboard to view their performance across campaigns they have participated in.
In addition to the campaign details, the view also shows key metrics, such as:
- the total number of calls made and handled
- the average talk time
| Column | Description |
|---|---|
| Agent |
The name of the agent |
| Campaign name |
The name of the campaign |
| Calls made |
Number of calls made in the campaign during the current day / overall campaign total |
| Handled |
The number of customers that have a campaign outcome and do not require more call attempts |
| Success |
Number of calls where the agent has classified the call as Success |
| Refusal | Number of calls where the agent has classified the call as Refusal |
| Called success rate |
Percentage of handled calls where the agent has classified the call as Success |
| Talking time avg. |
Average talking time for a campaign call, per campaign. Displayed as average talking time for the current day / average talking time overall for the campaign |
| Total talking time |
Cumulative talking time for connected campaign calls. For Predictive campaigns, this includes any time where prompts messages were played for a queuing customer. On the My Statistics tab, this only includes your talking time for the selected campaigns. |
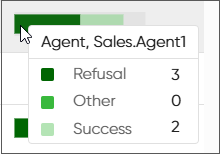
| Campaign progress |
Progress of the campaign shown as a stacked bar chart:
|