Dashboard
The following changes and improvements have been made in the area of Dashboard.
Keyword cloud
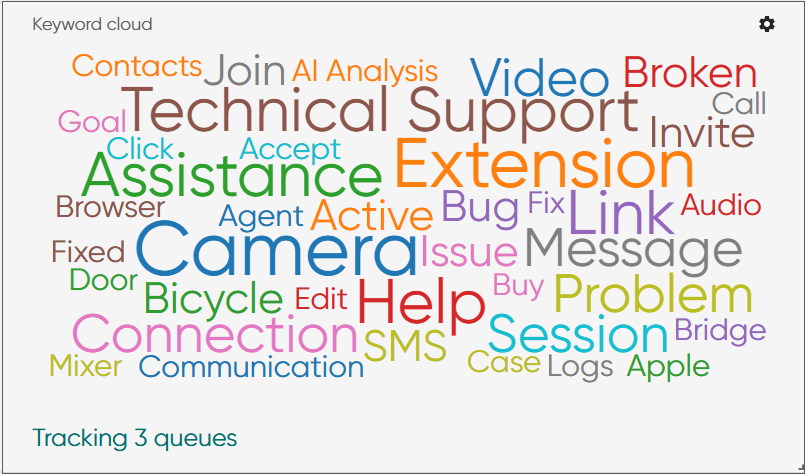
When AI analysis is enabled in the system, it analyzes queue conversation content of calls and emails and produces a summary and a list of keywords. A new card, Keyword cloud, offers a visual summary of conversation content generated by AI. Keywords extracted from the conversation are shown with varying sizes and colors to indicate their relative importance.
Refresh options
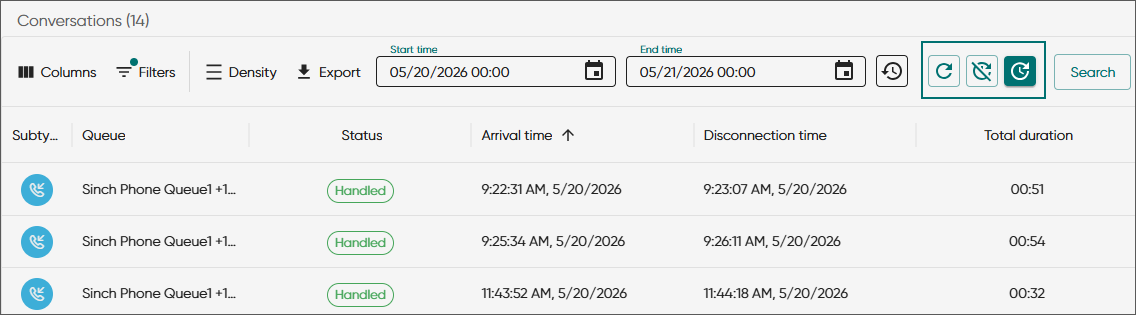
The following views have three options for how to refresh the information in the view: Agents, Conversations, Campaign statistics, Disruptions, and Emergency locations. The options are:
-
Manual refresh

-
No refresh

-
Auto-refresh

Auto-refresh is the default for the Today's statistics tab in the Agents view and for the Conversations view when the date range includes the current day. The other views have no refresh selected by default.
New filters
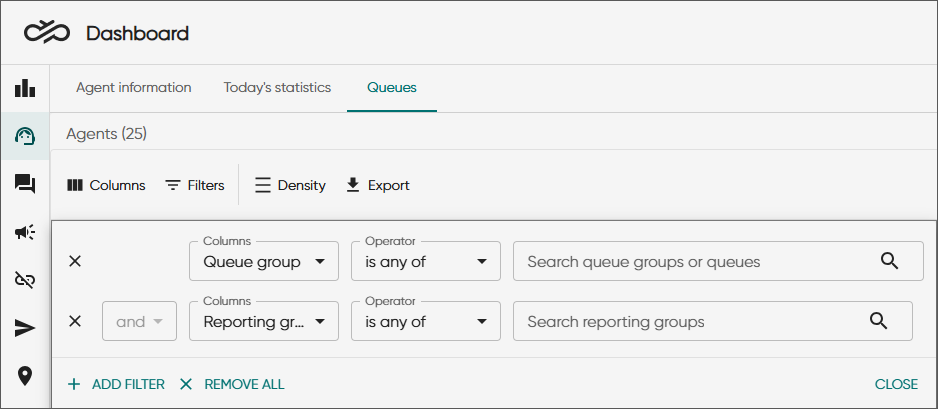
Dashboard has two new options in the Filters menu:
-
Queue group in the following views:
-
Queues tab in the Agents view
-
Conversations
-
-
Reporting group in the following views:
-
Agents:
- Today’s statistics
- Queues
-
Statistics view > Serving status > Agents card
-
Profile and Conversations columns
The columns Profile and Conversations have been added to the Today's statistics tab in the Agents view.
Terminology change
The text Monitoring [count] queues in In queue, Service level, and Longest queuing time cards has been changed to Tracking [count] queues. It works the same way as before so that clicking the hyperlink text shows the queues the card is following.
![]()