Dashboard Statistics Description
The following description and the example explain how the contact statistics are calculated in the Dashboard view.
Data Description
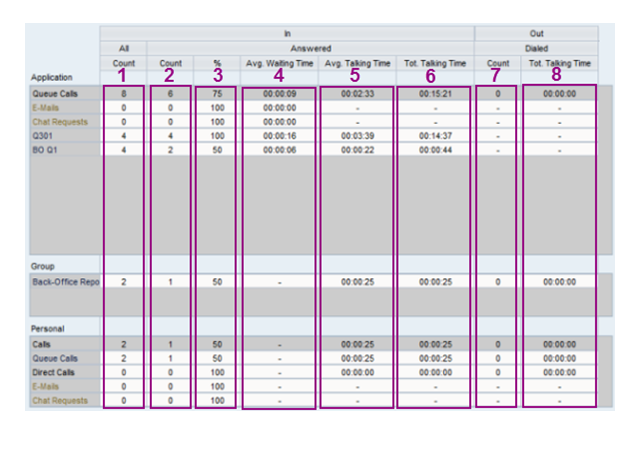
The figure and the table below describe the columns in the Dashboard view. The hyphen (-) in the figure indicates that a cell is not in use.
|
Column Number |
User Interface Element |
Description |
Contact Type |
Level |
|---|---|---|---|---|
|
1 |
Count |
The amount of incoming contacts |
Calls, e-mails, and chats |
Available at the application, group, and personal level |
|
2 |
Count |
The amount of answered contacts |
Calls, e-mails, and chats |
Available at the application, group, and personal level |
|
3 |
% |
The relative percentage of answered contacts |
Calls, e-mails, and chats |
Available at application, group, and personal level |
|
4 |
Avg. Waiting Time |
The average waiting time of contacts |
Calls, e-mails, and chats |
Available at the application level |
|
5 |
Avg. Talking Time |
The average duration of calls |
Calls |
Available at the application, group, and personal level |
|
6 |
Tot. Talking Time |
The total cumulative talking time of inbound calls |
Calls |
Available at the application, group, and personal level |
|
7 |
Count |
The total number of dialed calls |
Calls |
Available at the application, group, and personal level |
|
8 |
Tot. Talking Time |
The total cumulative talking time of dialed calls |
Calls |
Available at the application, group, and personal level |
The figure above is a snapshot of a user’s incoming contacts:
-
The application level (1) shows the number of contacts of the queues to which the user has rights.
First the contacts are listed by type and then by queue.
Note:If an e-mail you have handled has not arrived during the same day it is not included in the incoming e-mails count as the figure below demonstrates.
Figure 3. E-Mails in Dashboard View 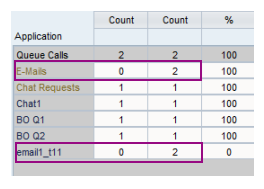
-
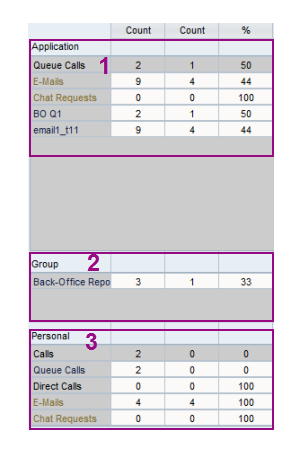
The group level (2) shows the calls of a group you belong to.
If you do not have rights to see the statistics of other users, your Group view is similar to your Personal view.
The figure
Group-Level Statistics
shows how the group-level statistics are compiled in the following case: There are two users inBack-Office Reporting Group
, user A and user B, and they serve in the queueBO Q1
. The first queue call was offered to the user A who did not answer. The caller hung up before the call was allocated to the user B. The second call was allocated first to the user A and then to the user B who answered the call. Although the second call is the same call allocated to two different users and answered and handled by the user B, the call is marked in both users’ statistics and also the group-level counts both allocations separately. Therefore the Group view shows 3 calls.Figure 4. Group-Level Statistics 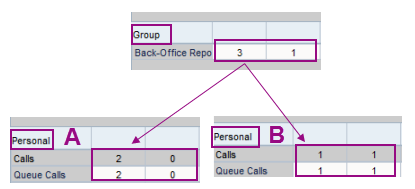
-
The personal level (3) shows all the contacts that have been allocated to you and the contacts you have handled.